


Distributed tracing with Linkerd
Using distributed tracing in practice can be complex. Linkerd can solve some of these challenges, but is not a silver bullet. For a high level explanation of how a service mesh can help with distributed tracing, see Distributed tracing in the service mesh: four myths.
This guide will walk you through configuring and enabling tracing for the emojivoto sample application. Jump to the end for some recommendations on the best way to make use of distributed tracing with Linkerd.
To use distributed tracing, you’ll need to:
- Install a trace collector and viewer on your cluster.
- Update Linkerd to enable tracing.
- Modify your application to emit spans.
In the case of emojivoto, once all these steps are complete there will be a topology that looks like this:

Warning
Install a trace collector
The first step to a distributed tracing setup is installing a way to collect, store, and view traces. The collector consumes spans emitted from the mesh and your applications and sends them to the viewer which stores them and serves a dashboard to view them.
One common tool to accomplish this is Jaeger, which includes a collector, storage, and trace viewer in its all-in-one installation We’ll use that for our examples.
To install Jaeger using Helm, first add the Jaeger Helm repository:
helm repo add jaegertracing https://jaegertracing.github.io/helm-charts
Then, install the Jaeger Helm chart:
helm install \
  --wait \
  --namespace jaeger-system \
  --create-namespace \
  --set allInOne.enabled=true \
  --set storage.type=memory \
  --set agent.enabled=false \
  --set collector.enabled=false \
  --set query.enabled=false \
  --set provisionDataStore.cassandra=false \
  jaeger jaegertracing/jaeger
Warning
Update Linkerd to enable tracing
There are a few values that need to be set on your Linkerd installation to enable exporting traces and to define where to send those traces. In this case, we’ll configure Linkerd to send traces to the Jaeger collector we just installed.
If Linkerd was installed with the CLI:
linkerd upgrade \
  --set proxy.tracing.enabled=true \
  --set proxy.tracing.collector.endpoint=jaeger-collector.jaeger-system:4317 \
  --setproxy.tracing.collector.meshIdentity.serviceAccountName=jaeger \
  --setproxy.tracing.collector.meshIdentity.namespace=jaeger-system \
  | kubectl apply -f -
Alternatively, if Linkerd was installed via Helm, add the following to the Helm values for Linkerd:
# values.yaml
proxy:
  tracing:
    enabled: true
    collector:
      endpoint: jaeger-collector.jaeger-system:4317
      meshIdentity:
        serviceAccountName: jaeger
        namespace: jaeger-system
Linkerd can export traces to any collector which supports the OpenTelemetry protocol. See the OpenTelemetry documentation for more information.
Note
meshIdentity stanza is mandatory: Linkerd can only export
traces to a collector within the mesh.Install Emojivoto
Add emojivoto to your cluster and inject it with the Linkerd proxy:
linkerd inject https://run.linkerd.io/emojivoto.yml | kubectl apply -f -
Before moving onto the next step, make sure everything is up and running with
kubectl:
kubectl -n emojivoto rollout status deploy/web
Modify the application
Unlike most features of a service mesh, distributed tracing requires some cooperation from the underlying application: it must propagate certain headers from inbound requests to any corresponding outbound requests.
This is because distributed tracing needs a way to tie incoming requests to your
application together with outgoing requests to dependent services. To do this,
headers are added to each request that contain a unique ID for the trace.
Linkerd will propagate both w3c and
b3 formats to tie these things
together.
Note
w3c and b3 headers are present, Linkerd will propagate only the
w3c headers.We’ve already modified emojivoto to instrument its requests with this information (see this commit).
To enable tracing in emojivoto, run:
kubectl -n emojivoto set env --all deploy OTEL_EXPORTER_OTLP_ENDPOINT=jaeger-collector.jaeger-system:4317
This command will add an environment variable that enables the applications to propagate context and emit spans. In the meantime, the collector installed with Linkerd-Jaeger will continue to support both protocols.
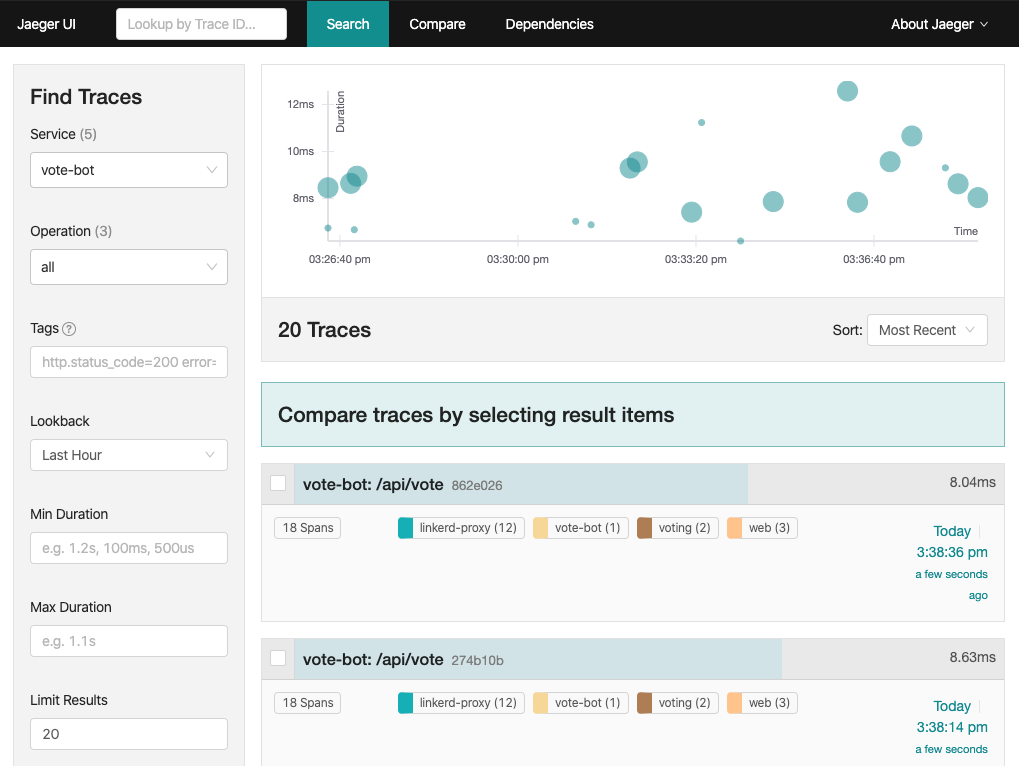
Explore Jaeger
With vote-bot starting traces for every request, spans should now be showing
up in Jaeger. To get to the UI, run:
kubectl port-forward -n jaeger-system svc/jaeger 16686
Then, open http://127.0.0.1:16686 in your browser.

You can search for any service in the dropdown and click Find Traces. vote-bot
is a great way to get started.
Clicking on a specific trace will provide all the details, you’ll be able to see the spans for every proxy!
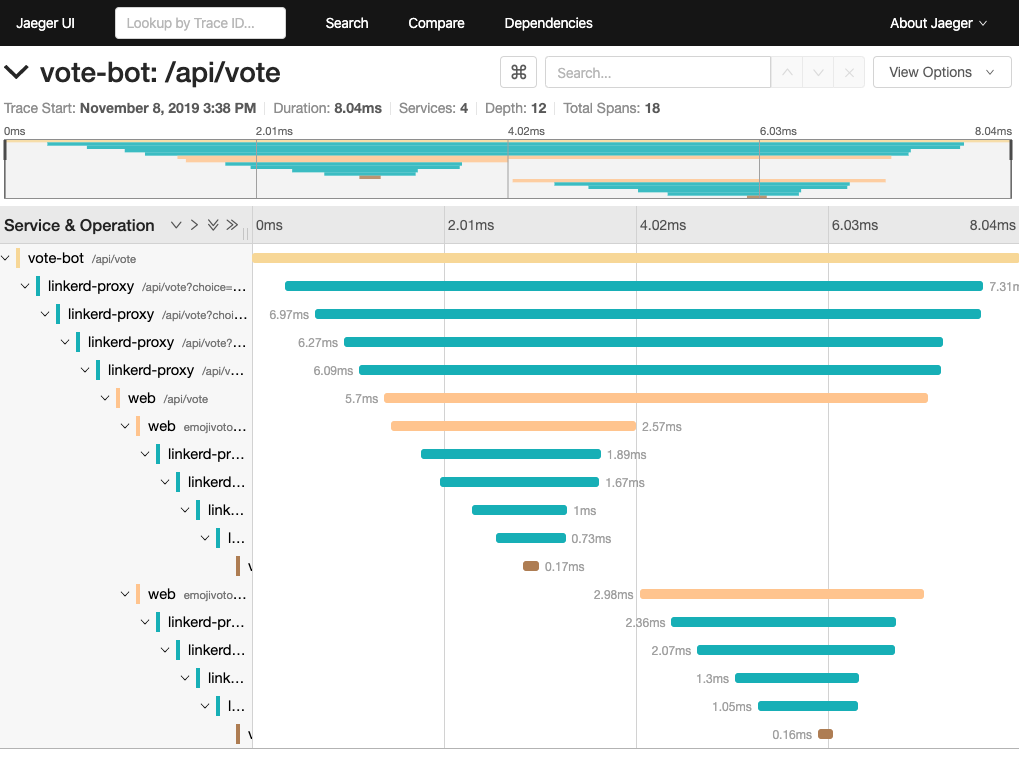
Note the large number of linkerd-proxy spans in the output. Internally, the
proxy has a server and client side. When a request goes through the proxy, it is
received by the server and then issued by the client. For a single request that
goes between two meshed pods, there will be a total of 4 spans. Two will be on
the source side as the request traverses that proxy and two will be on the
destination side as the request is received by the remote proxy.
Cleanup
To clean up, you’ll uninstall emojivoto, turn Linkerd tracing off, and finally uninstall Jaeger:
kubectl delete ns emojivoto
linkerd upgrade --set proxy.tracing=null | kubectl apply -f -
kubectl delete ns jaeger-system
Notes
If you don’t see any spans for the proxies
The Linkerd proxy prefers to use the w3c format, while also supporting the b3 format. Some client libraries, such as Jaeger, use different formats by default. We recommend that you configure your client library to use the w3c format to have the proxies participate in traces.
Ingress
The ingress is an especially important component for distributed tracing because it typically creates the root span of each trace and is responsible for deciding if that trace should be sampled or not. Having the ingress make all sampling decisions ensures that either an entire trace is sampled or none of it is, and avoids creating “partial traces”.
This reference architecture uses a traffic generator called vote-bot instead
of an ingress to create the root span of each trace.
Client libraries
While it is possible for applications to manually propagate trace propagation headers, it’s usually much easier to use a library. Typical distributed tracing libraries do three things:
- Propagate the trace context from incoming request headers to outgoing request headers
- Modify the trace context (i.e. starts a new span)
- Transmit this data to a trace collector
For example, the OpenTelemetry agent exporter will export trace data to the OpenTelemetry collector over a gRPC API. The details of how to configure OpenTelemetry will vary language by language, but there are guides for many popular languages.
Jaeger vs alternatives
In this guide, we used Jaeger, one of the most widely used tracing backends. However, any backend supported by OpenTelemetry can be used.
Proxy header propagation
If your application is injected with Linkerd, the Linkerd proxy will participate in the traces and will also emit trace data to the trace collector. This enriches the trace data and allows you to see exactly how much time requests are spending in the proxy and on the wire.
While Linkerd can only actively participate in traces that use the w3c or b3 propagation formats, Linkerd will always forward unknown request headers transparently, which means it will never interfere with traces that use other propagation formats.
